Monitoring that watches everything. Get paged for what matters.
One open-source engine for your network devices, server hardware, IP cameras, websites, hypervisors and IoT. Everything is an API call. Alerts stay quiet until something is really wrong.
Open source (MIT) · API-first · No built-in UI: dashboards via Grafana
First 10 credits free every month

Open source, MIT
No restrictive-license dependencies
One dependency
PostgreSQL only — no broker, no cache
Quiet by default
Noise is treated as a bug
Pay per use
No commitment, spend cap available
One place for the whole estate.
Built-in checks cover the devices that actually break. Add them by API, group them in a tree, and describe what depends on what.
Network devices
SNMP system, interfaces, UPS, PDU and sensors for switches, routers and power gear.
Server hardware
Redfish health for Dell, HPE and ASUS BMCs, plus ICMP reachability.
IP cameras
Stream and snapshot checks tell you when a camera is up but showing nothing.
Websites & ports
HTTP and ICMP checks with the same engine, intervals and alert rules.
Hypervisors & VMs
XCP-ng / XenServer pool and host checks, and PlusClouds VM agent telemetry.
IoT & facilities
HTTP push and an embedded MQTT broker for sensors that report on their own.
Fewer alerts. Every one of them real.
A switch dies and forty servers behind it go "down". Most tools send forty pages. This one sends one, because the engine knows what depends on what.
- Hysteresis and flap detection stop alert storms from unstable links
- Dependency suppression: only the root cause pages you
- Grouping, repeat reminders and escalation steps per incident
10:42:07  core-sw-01     DOWN      root cause
10:42:07  srv-rack3-01   suppressed (depends on core-sw-01)
10:42:07  srv-rack3-02   suppressed (depends on core-sw-01)
10:42:08  ... 38 more    suppressed

10:42:09  webhook        1 incident -> n8n   delivered
webhook-id: msg_2f9c...
webhook-timestamp: 1760000000
webhook-signature: v1,K5oZfzN9...

{
  "specversion": "1.0",
  "type": "incident.opened",
  "source": "monitoring",
  "data": { "device": "core-sw-01", "state": "down" }
}Signed webhooks into the tools you already run.
Incidents leave the engine as CloudEvents 1.0 over Standard Webhooks. Point them at n8n, Node-RED or the PlusClouds notification system and fan out to chat, email, tickets or phone.
- Every delivery is signed; verify it with any Standard Webhooks library
- Automatic retries, replay, and a delivery log you can inspect
- SSRF policy blocks webhooks aimed at your internal network
If you can curl it, you can monitor it.
There is no built-in UI to click through. The OpenAPI spec is the product, so onboarding a thousand devices is a script, not a weekend.
- Idempotent upserts by your own external ID — safe to re-run
- Declarative apply with dry-run before anything changes
- Credentials stored with envelope encryption
$ curl -X PUT $MON/v1/devices/by-external-id/core-sw-01 \
    -H "Authorization: Bearer $KEY" \
    -d '{"name":"core-sw-01","checks":["icmp","snmp.system"]}'

{ "id": "dev_8f2a...", "created": true }Tenancy is in the core, not bolted on.
Run it for yourself, or for every customer in a separate tenant. Every change lands in a tamper-evident audit log.
- Tenants, API keys and roles built in
- Hash-chained audit log so edits to history are detectable
- Runs standalone or embedded in the Leo panel
Standard formats, no lock-in.
Metrics live in partitioned PostgreSQL with 5-minute and hourly rollups, percentiles and API-controlled retention. Dashboards are Grafana over that database — no proprietary format to migrate away from. Tenant-facing Grafana is not available yet; customers query their metrics through the API.
- Grafana views for devices, websites, interfaces, hardware, power, XCP-ng and cameras
- Storage and retention included — no per-metric or per-host meter
- Usage endpoint for billing built into the engine
Your site is up. Whoopsy! tells you it's not fine.
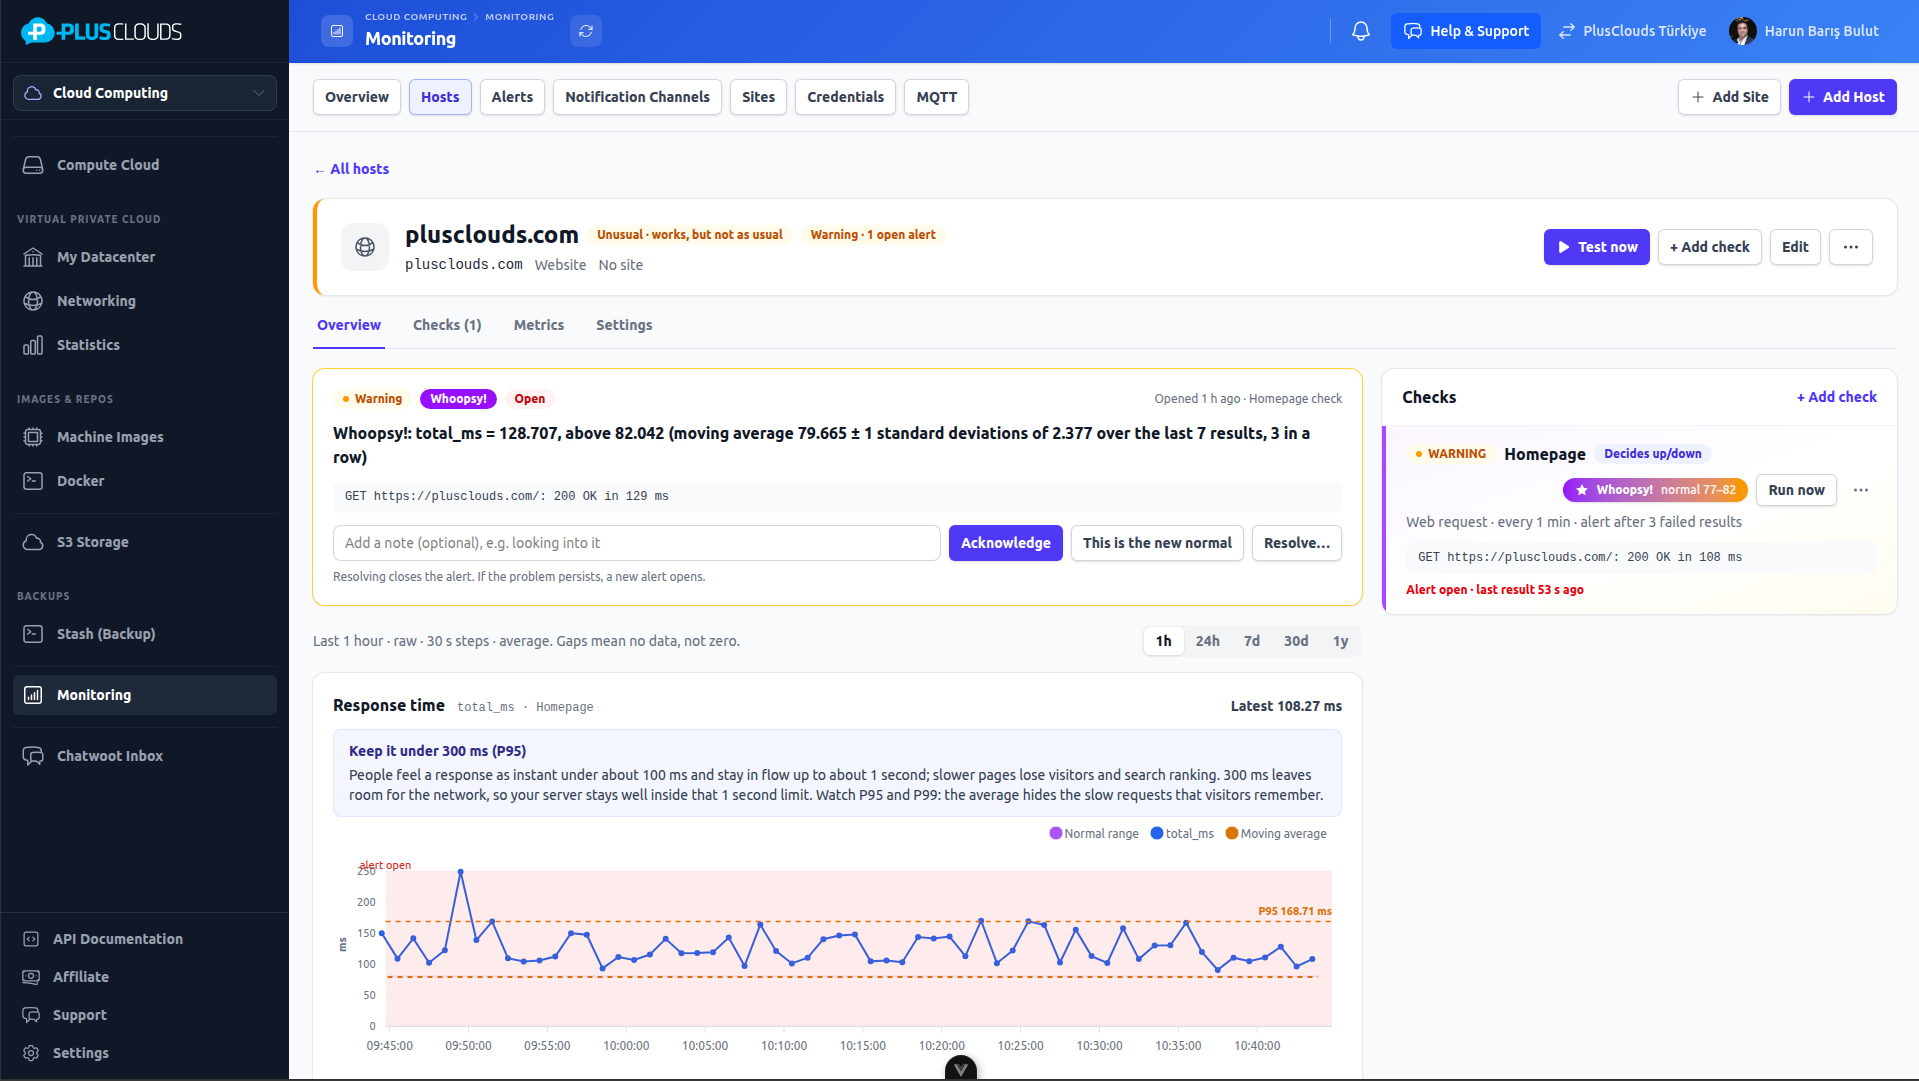
A fixed threshold only fires after things are already bad. Whoopsy! learns what normal looks like for each check and alerts when results drift out of that band, several in a row. You catch the slow leak and the creeping response time before a visitor does.
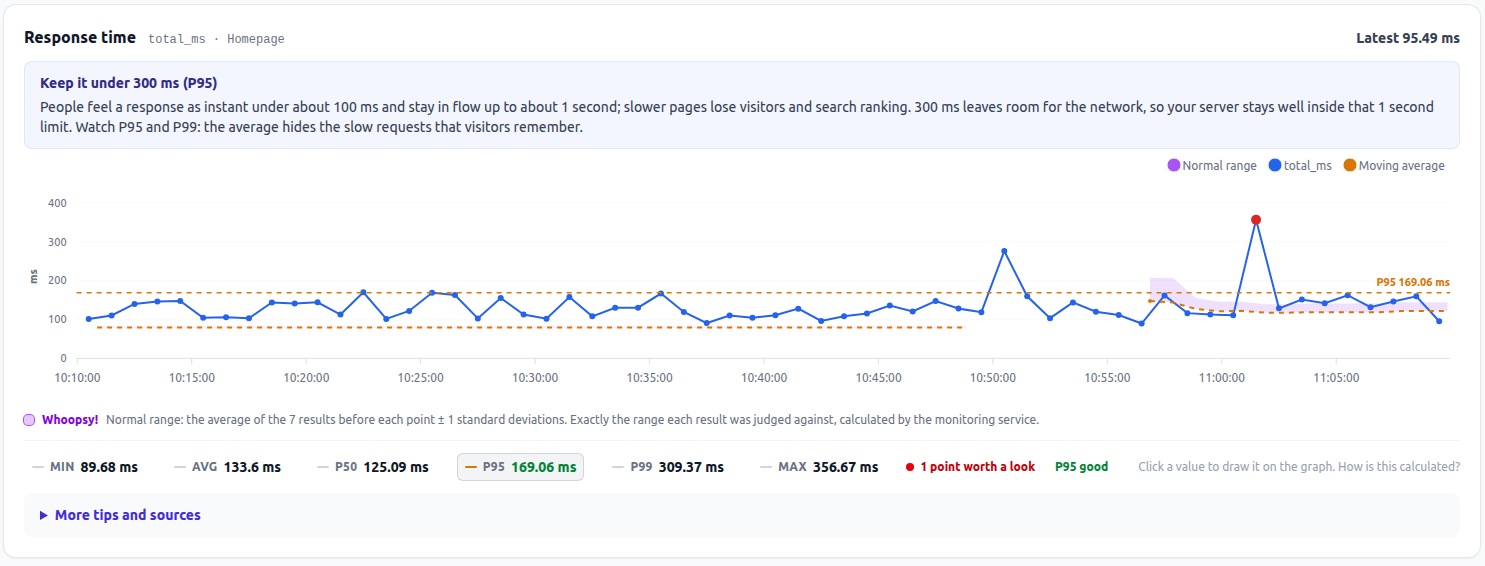
The purple band is "normal". The red dot is the point worth a look.
Learns normal
The band is a moving average of recent results, plus or minus N standard deviations.
Ignores one-off blips
It only opens an alert after N results in a row land outside the band.
Shows its working
The shaded band on the chart is the exact range each result was judged against.
Whoopsy! is a premium alert type, billed at 5× the plugin's weight.
Open source · MIT
Read the code. Run it yourself.
The monitoring engine is MIT licensed and developed in the open. Inspect how checks, incidents and webhooks work, file an issue, or self-host it next to your own PostgreSQL.
Pricing
Pay for the checks you run. Nothing else.
Billed hourly from weighted check usage. One credit is one weight-unit running for a 30-day month. Launch pricing for a limited time.
List price
$0.50
per credit
Launch price
$0.25
per credit
- Storage and retention included — no per-metric, per-log or per-host meter
- No commitment; a monthly spend cap with auto-pause is recommended
- Whoopsy! band alerting costs 5× the plugin's weight
What it costs in practice
| Item | Credits | At $0.50 | At $0.25 |
|---|---|---|---|
| Website (HTTP) | 2 | $1.00 | $0.50 |
| Server: Redfish, ping, SNMP system | 4 | $2.00 | $1.00 |
| Switch: ping, SNMP system, SNMP interfaces | 5 | $2.50 | $1.25 |
| XCP-ng pool of 10 hosts | 30 | $15.00 | $7.50 |
Credits per month, per check
| Check | Credits |
|---|---|
| icmp | 1 |
| http | 2 |
| snmp.get / system / ups / sensor | 1 |
| snmp.pdu | 2 |
| snmp.interfaces | 3 |
| redfish.health | 2 |
| xapi.pool:host | 3 |
| camera.snapshot | 2 |
| rtsp.stream | 2 |
| vm.agent | 2 |
| push.mqtt | 1 |
Launch pricing for a limited time. The free allowance resets monthly.
Honest about what is built — and what is not.
The engine is young. Everything above works today; what follows is planned and has no date.
Next
- Remote probes for private networks, with no inbound access needed
Planned
- VMware and Proxmox checks
- SNMP traps and syslog
- Templates and auto-discovery
- On-call schedules
- Status pages and SLA reports
- Terraform provider
- LLM monitoring: endpoints, GPUs, traces, cost
Not in scope
- Built-in UI (dashboards come from Grafana)
- Log management
- General APM and tracing
- Full CMDB, Hyper-V
Start monitoring today.
First 10 credits free every month. No commitment.
- Free to start
- Join the PlusClouds community
- Invite friends and earn credits
A credit card is only needed when you deploy cloud servers
Questions about Monitoring
Is it really open source?
Yes. The engine is MIT licensed and written in Go. A CI-enforced license allowlist keeps restrictive-license dependencies out.
What do I need to run it?
One binary and a PostgreSQL database. There is no message broker, cache or separate time-series database. Metrics are stored in partitioned PostgreSQL.
Is there a dashboard UI?
There is no built-in UI. Dashboards are Grafana over the metrics database, and everything else is the API. Tenant-facing Grafana is not available yet, so customers read their data through the API.
How do alerts reach my team?
Through signed webhooks (CloudEvents 1.0 over Standard Webhooks). Send them to n8n, Node-RED or the PlusClouds notification system and route to chat, email, tickets or phone from there.
How is it priced?
Pay as you go, based on weighted check usage. The first 10 credits are free every month. List price is $0.50 per credit, with a $0.25 launch price for a limited time. There is no commitment. The launch price applies for a limited time.
Can it monitor devices on a private network?
Remote probes that need no inbound access are the next milestone and are not available yet. Today the engine reaches devices it can route to.
Is it ISO 27001 certified?
No. The design maps to ISO/IEC 27001 controls as a design aid, but there is no certification.
← Back to Cloud Infrastructure
Still have questions?
For purchases and detailed information, schedule a meeting — or reach us directly:
Get started for free
Deploy your first cloud server in minutes. No credit card required to explore.