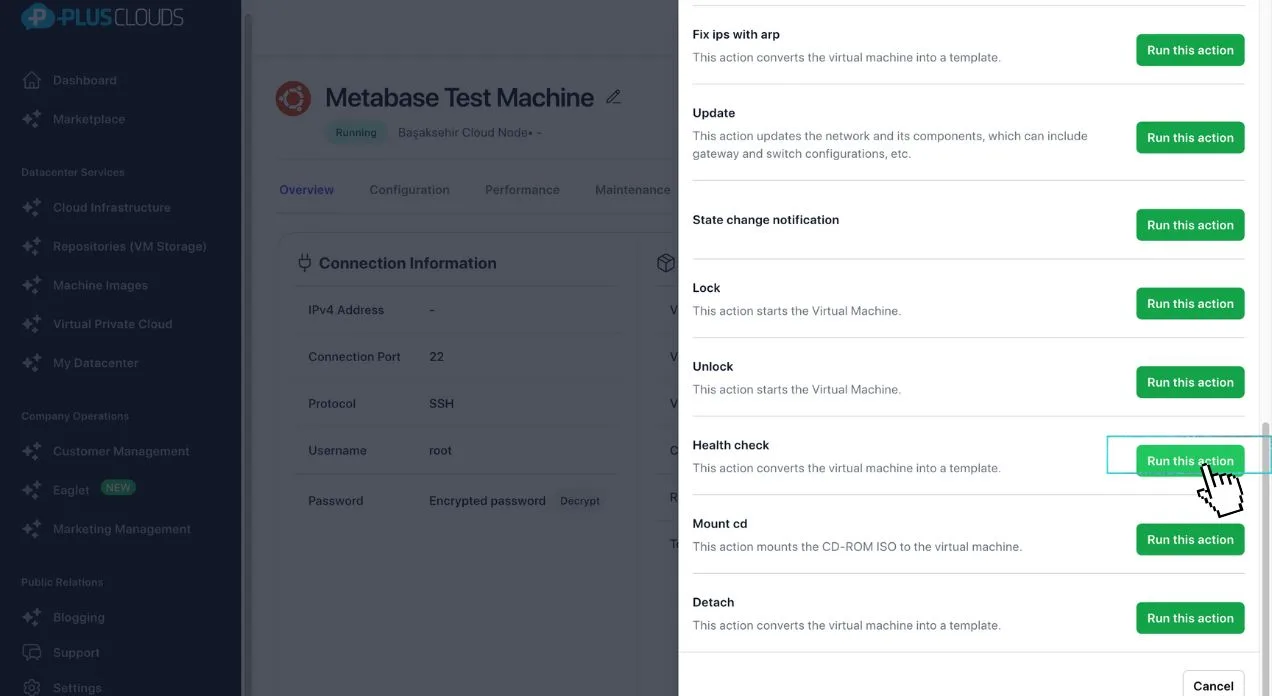
فحوصات الصحة
Your users find the outage.
Or we do — 5 minutes earlier.
Most monitoring tools alert you after something breaks. Health Checks detect degradation before it becomes an outage — and automatically route traffic away from the problem.

The Problem
Reactive monitoring costs you customers.
A server that's 90% degraded will still pass a basic "is it up?" ping. Your users will feel it. Health Checks run deeper — HTTP response codes, latency thresholds, CPU/memory, TCP port availability — so you know about the problem first.
كيف يعمل
3 steps from degradation to fix.
1. Define your checks
Set endpoints, probe types (HTTP, TCP, gRPC), frequency, and failure thresholds. Takes 2 minutes to configure.
2. Continuous probing
PlusClouds sends probes at your configured interval — every 10 seconds if you want. Latency, status codes, and resource metrics are all collected.
3. Auto-alert or auto-fix
Consecutive failures trigger an alert. Or connect to orchestration: unhealthy nodes are automatically drained and traffic is rerouted. No manual intervention.
ما الذي تحصل عليه
Built-in. No extra tools needed.
Catch issues before users do
Latency spikes, memory pressure, degraded endpoints — detected in seconds, not after a support ticket.
Traffic routes around problems
When a node fails checks, it's automatically drained. Healthy nodes absorb the traffic instantly.
No ops team required
Runbooks auto-resolve 80% of incidents. An engineer is paged only when automation can't fix it.
Full history & root cause
Every probe result is stored. When something does fail, you have the full timeline to debug it fast.
Set up your first health check in 2 minutes.
No credit card required. Deploy and configure in one dashboard.
Common questions
ما زالت لديك أسئلة؟
لإجراء عمليات الشراء والحصول على معلومات مفصلة، قم بجدولة اجتماع — أو تواصل معنا مباشرة:
ابدأ مجانًا
انشر أول خادم سحابي لك في دقائق. لا يتطلب بطاقة ائتمان للاستكشاف.