- What is Regression?
- Basic Concepts
- Most Common Types of Regression and Application Examples
- How is Regression Analysis Done?
- Evaluation Metrics
- In Which Areas is Regression Used?
- Transforming Regression into Business Processes with Kolay.AI
- Advantages of Regression
- Limitations of Regression
- Conclusion
Data science, statistics, and machine learning frequently encounter the concept of regression. Regression is a powerful analytical method aimed at understanding, modeling, and predicting relationships between variables. It is particularly used in business, healthcare, finance, and social sciences.
In this article, we will discuss in detail what regression analysis is, how it works, its types, areas of use, and example applications.
.jpg")
What is Regression?
Regression analysis is a statistical method aimed at analyzing how a dependent variable (i.e., the outcome or target variable) changes based on one or more independent variables (explanatory variables).
To provide a more technical definition:
Regression is the prediction of a function that describes the relationship between one variable and other variables (often linear or curvilinear).
This method not only infers from existing data but is also used to make forecasts about the future.
Basic Concepts
Dependent Variable (Y)
It is the variable to be predicted. For example, the monthly sales amount of a company.
Independent Variables (X₁, X₂, ..., Xₙ)
These are inputs believed to affect the dependent variable. Factors such as advertising budget, discount rate, and number of customers can affect the sales amount.
Regression Coefficients (β₀, β₁, β₂, ...)
These coefficients determine the impact of the independent variables on the dependent variable. The model learns these coefficients from the data.
Error Term (ε)
Represents the random variables and external factors that the model cannot explain.
Most Common Types of Regression and Application Examples
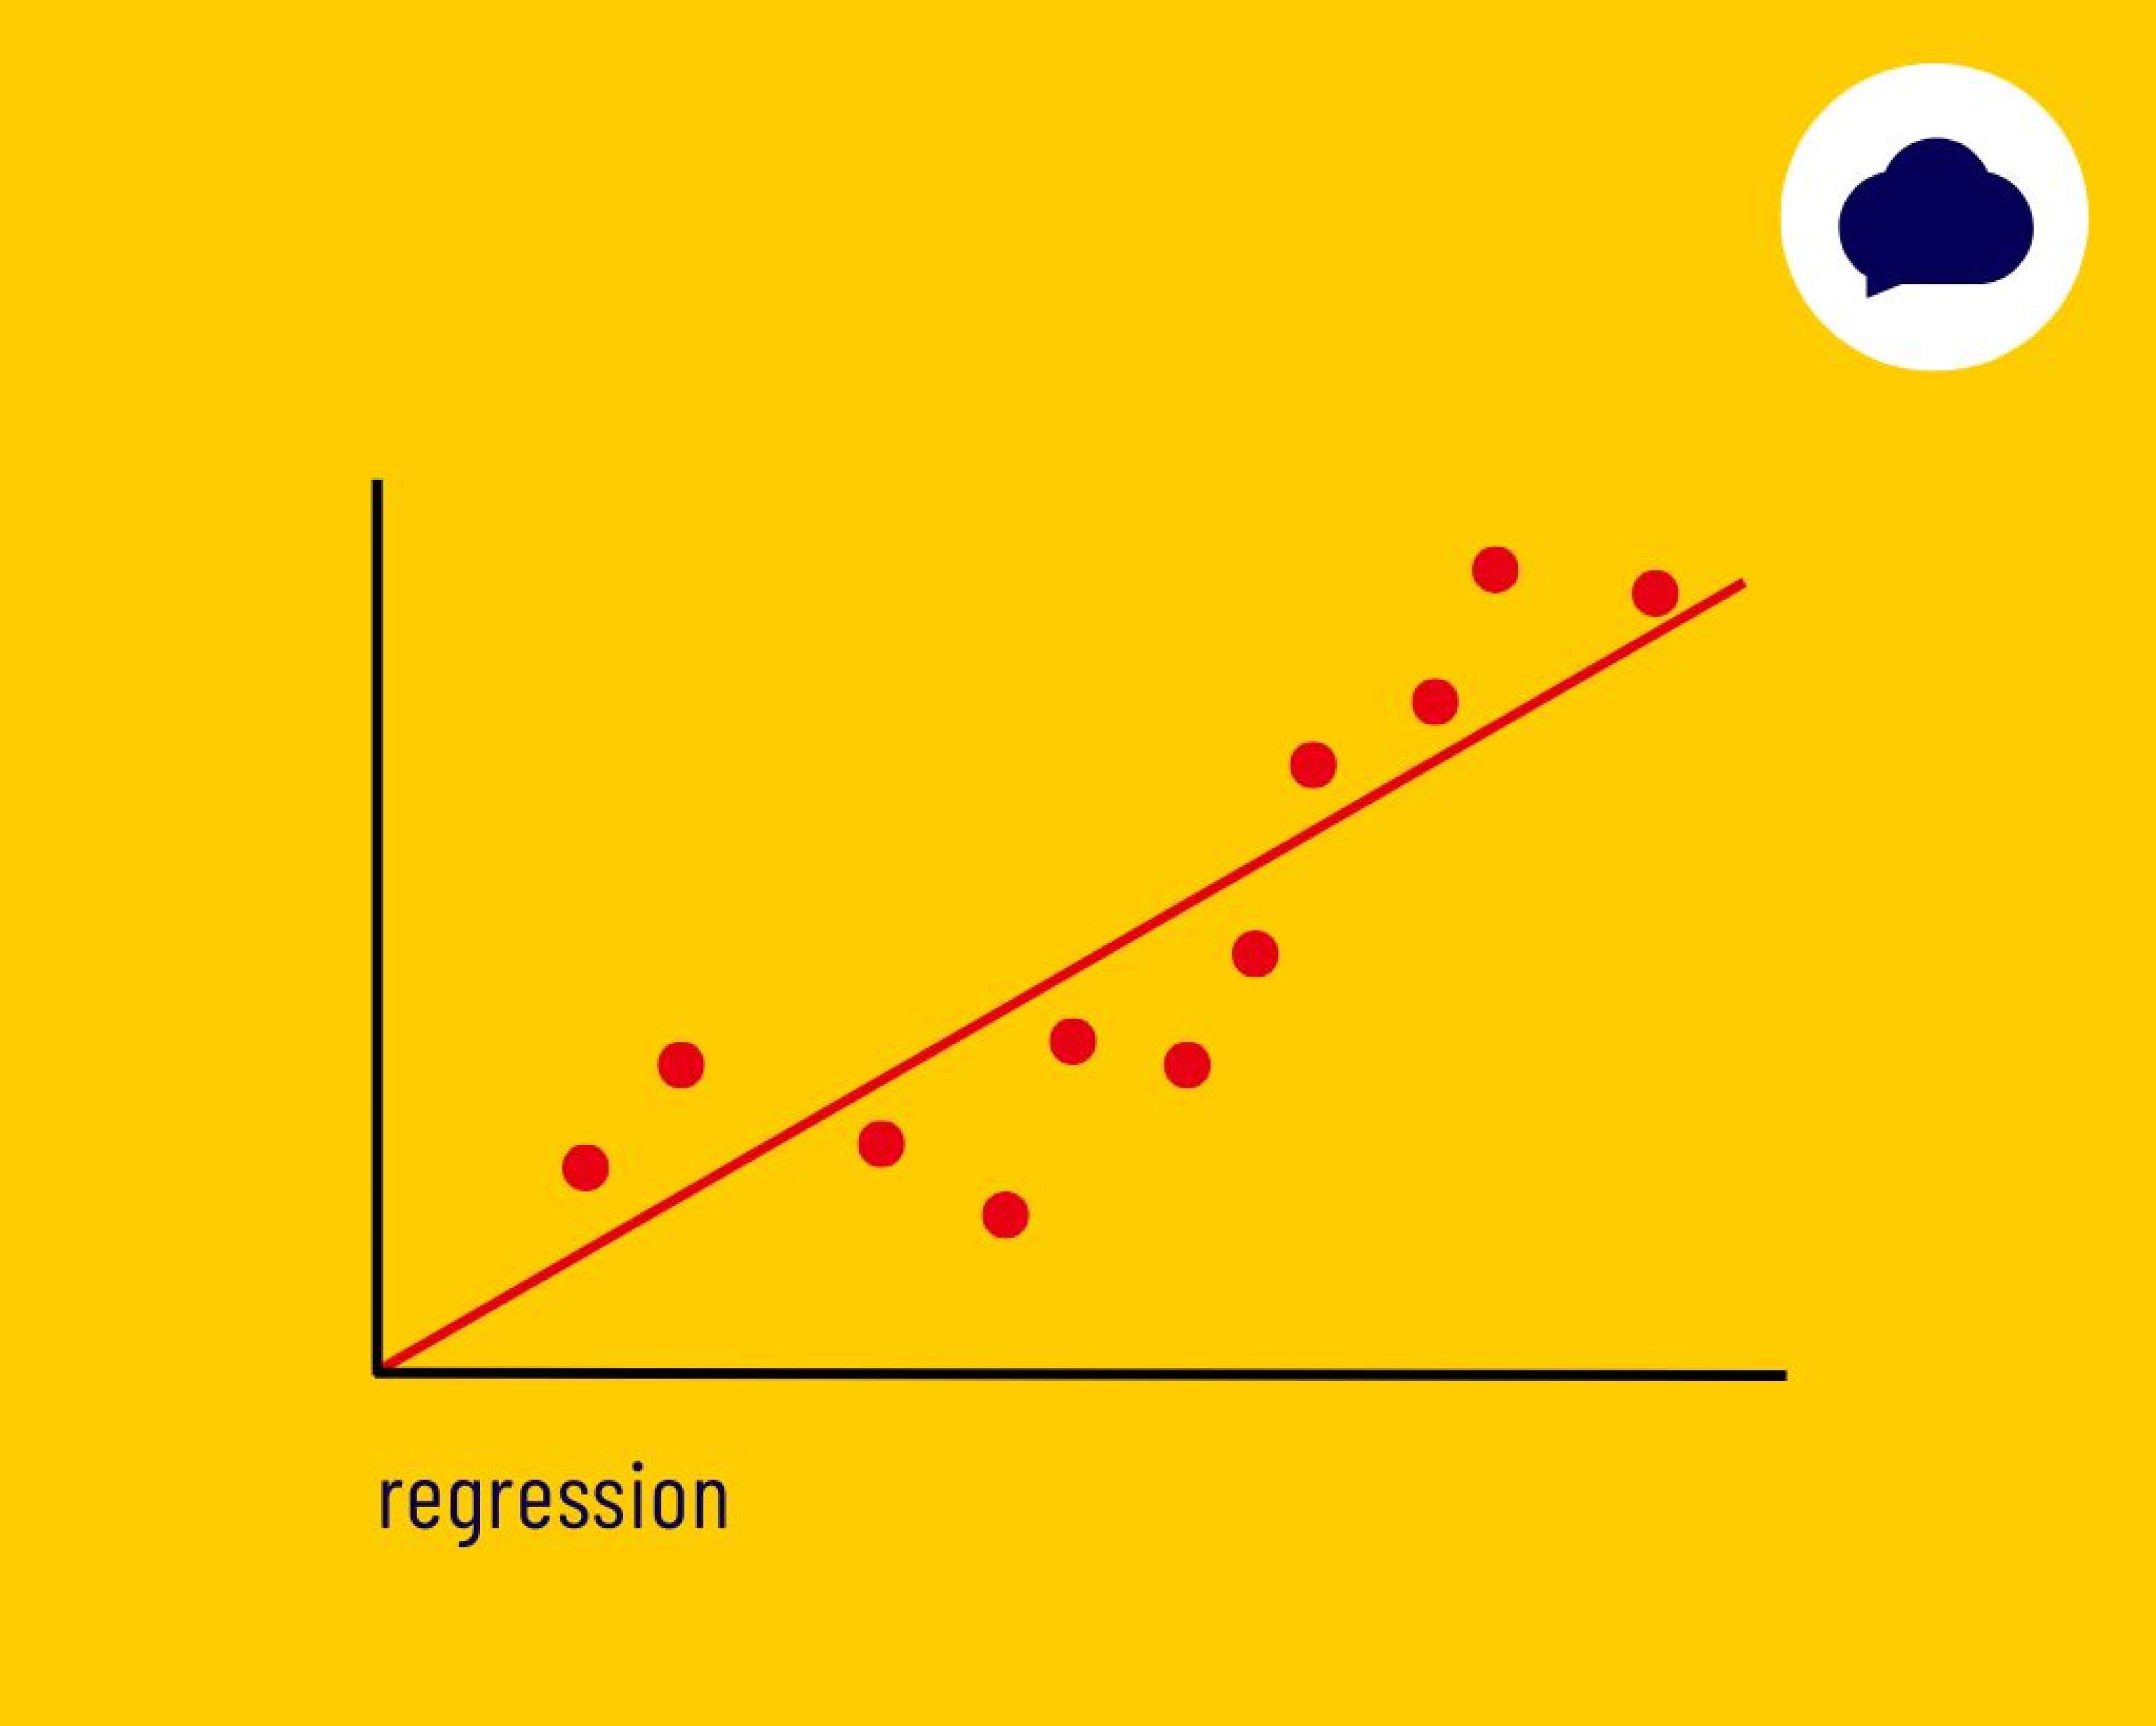
1. Linear Regression
This is the most basic type of regression. It assumes a linear relationship between the dependent and independent variables.
Model Formula:
Y = β₀ + β₁X + ε
Example:
Let’s assume we want to predict the occupancy rate of a hotel based on advertising spending.
Y: Occupancy rate
X: Monthly advertising expenditure (thousand TL)
In the above model, if β₁ is positive, it is expected that as advertising spending increases, the occupancy rate will also increase.
2. Multiple Linear Regression
Used in situations where there are multiple independent variables.
Model Formula:
Y = β₀ + β₁X₁ + β₂X₂ + ... + βₙXₙ + ε
Example:
We want to predict the selling price of a house. The variables could be:
X₁: Square meters
X₂: Number of rooms
X₃: Building age
X₄: Neighborhood score (a score indicating whether the area is valuable)
In this case, the model predicts the house price by taking these four factors into account.
3. Logistic Regression
Used in situations where the dependent variable is categorical (e.g., yes/no, sick/healthy). The output is a probability value between 0 and 1.
Model Formula:
P(Y=1) = 1 / (1 + e^-(β₀ + β₁X₁ + β₂X₂ + ... + βₙXₙ))
Example:
We want to predict whether a student will pass an exam.
Y: 1 (passed), 0 (failed)
X₁: Study time (hours)
X₂: Attendance rate (%)
X₃: Previous grade point average
This model predicts the probability of passing the exam based on the student’s data.
4. Polynomial Regression
Used when the relationship between the dependent and independent variables is not linear (for example, if it is in the form of curves).
Model Formula:
Y = β₀ + β₁X + β₂X² + β₃X³ + ... + βₙXⁿ + ε
Example:
We want to model a car's fuel consumption according to its speed. Fuel consumption may decrease in a certain speed range but can increase again at very high speeds. In this case, there is a curvilinear relationship.
How is Regression Analysis Done?
1. Data Collection: A sufficient number of samples need to be collected from reliable sources.
2. Data Preprocessing: Missing data is filled in or cleaned, and outliers are checked.
3. Model Setup: The appropriate type of regression is determined.
4. Model Training: Regression coefficients are calculated from the data.
5. Model Evaluation: Accuracy and error rates are measured with various metrics (R², MAE, RMSE).
6. Prediction and Interpretation: Predictions are made with new data, and results are used in business decisions.
Evaluation Metrics
R² (R-squared): Shows how much of the data the model explains. It takes a value between 0 and 1.
MAE (Mean Absolute Error): The average absolute difference between predicted and actual values.
RMSE (Root Mean Squared Error): The square root of the average of the squared errors. It is more sensitive to larger errors.
In Which Areas is Regression Used?
Economics and Finance:
Prediction of stock returns based on interest rates
Credit score modeling
Marketing:
Effect of advertising expenditure on sales
Customer lifetime value prediction
Health:
Probability of catching a certain disease
Relationship between drug dosage and recovery time
Real Estate:
- Modeling home prices based on location, size, and building age
Social Sciences:
- Relationship between education duration and income level
Transforming Regression into Business Processes with Kolay.AI
Modern businesses want to gain a competitive advantage by integrating insights from regression analysis into real-time business processes. This is where PlusClouds' Kolay.AI solutions come into play.
Kolay.AI offers:
• Sales Forecasting: Provides accurate sales forecasts by considering market trends and external factors. This makes inventory management and revenue planning much more reliable.
• Revenue-Expense Analysis: Analyzes your company's financial health and predicts future expenses and revenues.
• Customer Segmentation: Identifies potential loyal customers, those at risk of attrition, and star customers through regression-supported analyses. This enables more targeted marketing strategies.
• Personalized Product Recommendations: Offers product recommendations based on customer behavior, increasing customer satisfaction and sales rates.
• Weekly AI Reports: Provides data-backed recommendations specifically prepared for management. This allows managers to make strategic decisions based on data rather than intuition.
With Kolay.AI, regression analyses transform from merely a technical concept into practical tools that directly guide business decisions. Thanks to advanced algorithms, it not only understands your data but also turns it into strategic actions.
Advantages of Regression
• Interpretability: Regression coefficients explain the impact of variables.
• Quick applicability: Particularly efficient in terms of computation in small data sets.
• Predictive capability: Provides insights for future decisions.
Limitations of Regression
The assumption of a linear relationship may not always be valid.
Outliers can distort model performance.
The accuracy of the dependent variable directly affects the overall success of the model.
It shows correlation rather than causality. That is, it indicates that one variable is "related" to another rather than "causing" it.
Conclusion
Regression analysis is an indispensable component of extracting meaning from data and decision support systems. Whether it is a simple sales forecast or a multifactorial risk assessment, regression methods offer scientific ways to interpret data.
Effectively using regression provides significant advantages in making more accurate predictions and better understanding relationships between variables.